- D3.js 简介
- SVG 基础
- 选择集与数据
1. D3.js 简介

使用 D3.js 的优点
- D3 能够将数据和DOM绑定在一起
- 不同于其他可视化工具,使用 D3 绘制各种类型的图表拥有更多的自由度
- 类似于 jQuery 的连缀语法使得代码更加简洁
- 大量的布局,能够适应各种图表制作需求
- 基于SVG,具有很好的交互性和动态性
2. 图表类型
-
Bar Chart 柱形图/条形图
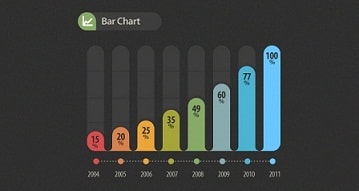
Bar chart 主要用于可视化时间序列中离散的数据点;
当分类项目的标签文本比较长的时候,柱形图的标签不便于排版,这时使用条形图更加合适。
-
Line Chart 折线图/曲线图
Line chart 主要用于可视化连续型的时间数列数据,强调数据在一个时间序列上的变化趋势;
柱形图更适于数据点较少的情况;曲线图更适于数据点较多的场景。
-
Pie Chart 饼图
Pie Chart 主要用于可视化比例分布数据,展现整体中各个部分所占的比例关系。
饼图的缺点:扇区之间不便于比较大小,特别是比较接近的时候。
饼图的优点:会给我们一种整体和构成的印象,看到饼图我们就会想起100%,这是条形图所没有的。
使用饼图的技巧:
- 尽量不使用3D效果、透视效果:
- 这些效果会增加我们分辨扇区大小的难度
- 扇区要少,最好是2~3片:
- 这样就弱化了扇区间的大小比较。数据点较多时,不建议使用饼图。
- 用颜色组合扇区:
- 饼图的扇区较多时,可以利用颜色再组合为几个大分类
- 标签要整齐:
- 饼图的标签极易显得凌乱,我们需要使用一些小技巧来对齐标签,是图表做得更专业。
-
Circos 弦图
 图片来自 http://circos.ca
3. D3.js WEB 基础
D3.js 的兼容性

由于 D3.js 使用的是 SVG ,而 IE8 及以下浏览器不支持 SVG ,因此 D3.js 一般不支持 IE8 及以下浏览器。
SVG 基础
与其他图像格式相比,使用 SVG 的优势在于:
- SVG 可被非常多的工具读取和修改(比如记事本)
- SVG 与 JPEG 和 GIF 图像比起来,尺寸更小,且可压缩性更强
- SVG 可在图像质量不下降的情况下被放大
使用 SVG 绘制基本图形:
-
rect 矩形
<svg width="300" height="120" style="outline:1px solid #000;"> <rect x="50" y="10" width="200" height="100" rx="20" ry="20" style="fill:#d3ffb5;stroke:#00b91d;stroke-width:5;" /> </svg> -
circle 圆形
<svg width="300" height="120" style="outline:1px solid #000;"> <circle cx="150" cy="60" r="50" style="fill:#d3ffb5;stroke:#00b91d;stroke-width:5;" /> </svg> -
ellipse 椭圆
<svg width="300" height="120" style="outline:1px solid #000;"> <ellipse cx="150" cy="60" rx="100" ry="50" style="fill:#d3ffb5;stroke:#00b91d;stroke-width:5;" /> </svg> -
line 线段
<svg width="300" height="120" style="outline:1px solid #000;"> <line x1="20" y1="100" x2="280" y2="20" style="stroke:#00b91d;stroke-width:5;" /> </svg> -
polygon 多边形
<svg width="300" height="120" style="outline:1px solid #000;"> <polygon points="100,40 200,40 110,100 150,10 190,100" style="fill:#d3ffb5;stroke:#00b91d;stroke-width:2;" /> </svg> -
polyline 折线
<svg width="300" height="120" style="outline:1px solid #000;"> <polygon points="100,40 200,40 110,100 150,10 190,100" style="fill:#d3ffb5;stroke:#00b91d;stroke-width:2;" /> </svg> -
text 文本
<svg width="300" height="120" style="outline:1px solid #000;">
    <text x="100" y="90" dx="10" dy="-10" rotate="-15" textLength="160" style="fill:#00b91d;">
        <tspan font-weight="bold" fill="#f10017">D3.js </tspan>发现数据之美
    </text>
</svg>
使用
<tspan>标签对文本中的特定文字定义单独的样式。
在 SVG 中,常用的样式名称和我们一般的 HTML 标签的样式名称不一样,但基本上是一个对应关系:
| SVG 样式 | 常规 样式 |
|---|---|
fill:填充色,<text> 文本的字体颜色 |
相当于 background-color 和 字体的 color |
| stroke:轮廓线颜色 | 相当于 border-color |
| stroke-width:轮廓线宽度 | 相当于 border-width |
滤镜 <filter> 和渐变 <linearGradient>(线性渐变)、<radialGradient>(径向渐变)都是写在 <defs> 标签中的, defs 用与定义可重复利用的图形元素。
<svg width="300" height="120" style="outline:1px solid #000;">
    <defs>
        <filter id="GaussianBlur">
            <feGaussianBlur in="SourceGraphic" stdDeviation="5" />
        </filter>
    </defs>
    <rect x="50" y="20" width="200" height="80" fill="#00b91d" filter="url(#GaussianBlur)"></rect>
</svg>
<svg width="300" height="120" style="outline:1px solid #000;">
    <defs>
        <linearGradient id="multiColor" x1="0%" y1="0%" x2="100%" y2="100%">
            <stop offset="0%" stop-color="#f00" />
            <stop offset="20%" stop-color="#ff8100" />
            <stop offset="40%" stop-color="#efff00" />
            <stop offset="50%" stop-color="#0f0" />
            <stop offset="70%" stop-color="#07ffc6" />
            <stop offset="100%" stop-color="#ff00f7" />
        </linearGradient>
    </defs>
    <rect x="50" y="20" width="200" height="80" fill="url(#multiColor)"></rect>
</svg>
<svg width="300" height="120" style="outline:1px solid #000;">
    <defs>
        <radialGradient id="radialGradient" cx="50%" cy="50%" r="50%" fx="50%" fy="50%">
            <stop offset="0%" style="stop-color:#f00;stop-opacity:.8"/>
            <stop offset="100%" style="stop-color:#ff0;stop-opacity:.8"/>
        </radialGradient>
    </defs>
    <ellipse cx="150" cy="60" rx="100" ry="50" fill="url(#radialGradient)" />
</svg>
4. D3.js 选择器和 DOM 操作
D3.js 选择器
d3.select- 从当前文档中选中与指定选择器字符串匹配的第一个元素
d3.selectAll- 从当前文档中选中匹配指定选择器的所有的元素
selection.empty()- 返回true如果当前选择为空;一个选择是空的,如果它不包含任何元素或null元素
selection.node()- 返回当前选择的第一个非空的元素。如果选择为空,则返回null
selection.size()- 返回当前选择的元素个数
D3.js DOM 操作
selection.attr(name[, value])- 设置或获取选中元素的属性
selection.classed(name[, value])-
设置选中元素的 class
- 如果 value 为真,则给选中元素添加该 class。如果为假,则移除 class
- 如果 value 是一个函数,那么这个函数会为每个选中的元素(按顺序)计算,可以引入当前数据元素
d和当前索引i作为参数。 - 如果 value 没有指定,则根据选中元素是否有指定的 class 返回 true 或者 false
一次设置多个 class 的写法有两种:
selection.classed({'class1': true, 'class2': false})selection.classed('class1 class2', true)
selection.style(name[, value[, priority]])-
设置或返回选中元素的样式属性值
设置多个样式的写法类似于 jQuery:
selection.style({'stroke': '#000', 'stroke-width': 1}) selection.property(name[, value])-
一些HTML元素具有特殊的属性(比如
input:text的 value 属性,复选框的 checked 属性),不能使用 attr() 方法访问,可以使用property操作符来获取或设置这些属性一次设置多个属性:
selection.property({'foo': 'bar', 'baz': 'qux'}) selection.text([value])-
基于 textContent 属性,设置文本内容将取代所有子元素,如果没有指定 value 值,则会获取到所有子元素的文本内容
selection.html([value])-
基于 innerHTML 属性,设置内部HTML内容将取代任何现有的子元素,如果没有指定 value 值,则会获取到选中元素开始和结束标签之间的 HTML 内容
selection.html 仅支持 HTML 元素。 SVG 元素和其它非 HTML 元素不支持 innerHTML 属性
selection.append(name)-
在被选元素的结尾(仍然在内部)插入指定 name 的新元素,类似于 jQuery 中的 append() 方法
selection.insert(name[, before])-
在被选元素的内部,指定的 before 选择器之前插入具有指定 name 的新元素,如果before选择器不匹配任何元素,则该方法相当于 append 方法
selection.remove()-
删除选择中的元素
5. D3.js 数据绑定和数据处理
selection.datum([value])
源码如下:
d3_selectionPrototype.datum = function(value) {
    return arguments.length ? this.property("__data__", value) : this.property("__data__");
  };
获取或设置每个选定的元素绑定的数据。
如果指定 value,就为所有选中的元素设置元素的绑定数据为指定的值。
如果未指定 value,则返回在选择中绑定第一个非空的元素的数据
苹果
香蕉
樱桃
function d3DatumTest(){
        var fruit = ["Apple","Banana","Cherry"];
        var $p = d3.select('#d3-datum').selectAll('p');
        $p.datum(fruit)
            .text(function(d,i){
                return d[i];
            })
            .append('span')
            .text(function(d,i){
                return " "+d[i];
            })
            .style({'color':'#f00'})
        ;
        console.log($p);            //[Array[3]]
        console.log($p.datum());    //["Apple", "Banana", "Cherry"]
    }
    d3DatumTest();
下图显示了 datum() 方法是如何将数据绑定到元素上的,以及在被绑定数据的元素中添加的子元素会继承该元素绑定的数据:

selection.data([values[, key]])
将数组的每一项分别绑定到选中的各元素上,而 datum 方法是将整个数组绑定到了各选中的元素上。
- 数组长度 = 元素数量
- update
- 数组长度 > 元素数量,多余部分数据表示缺失元素,需要添加元素
- enter
- 数组长度 = 元素数量,多余部分元素表示退出数据绑定
- exit
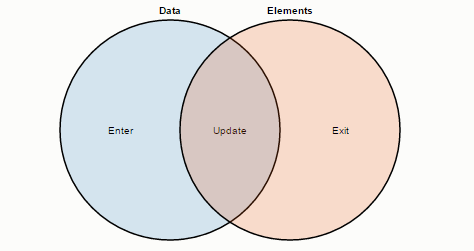 图片来自:https://bost.ocks.org/mike/join/
function d3DataTest(){
        var fruit = [
            {name: "Apple", amount: 9},
            {name: "Banana", amount: 5},
            {name: "Cherry", amount: 2}
        ];
        var $p = d3.select('#d3-data').selectAll('p');
        $p.data(fruit)
            .text(function(d){
                return d.amount+" : "+ d.name;
            });
        console.log($p);
    }
d3DataTest();
selection.enter() & selection.exit()
selection.enter()返回缺失元素的部分
function d3EnterTest(){
        var fruit = ["Apple","Banana","Cherry","Durian","Fig"];
        var $p = d3.select('#d3-enter').selectAll('p');
        $p.data(fruit)
            .enter(fruit)
            .append('p')
            .text(function(d){
                return d;
            })
    }
d3EnterTest();
selection.exit()返回需要退出数据绑定的部分
function d3ExitTest(){
        var fruit = ["Durian","Fig"];
        var $p = d3.select('#d3-exit').selectAll('p');
        $p.data(fruit)
            .text(function(d){
                return d;
            })
            .exit()
            .remove();
    }
d3ExitTest();
画一个简单的柱形图
text-anchor属性用于设置 SVG 中 <text> 标签相对于一个指定的坐标的对齐方式,该属性可能的值有:start | middle | end | inherit 。

可以更新数据的柱形图
6. 比例尺和坐标轴
Scales are functions that map from an input domain to an output range.
比例尺是把输入域映射为输出范围的函数。
定义域连续的是数值比例尺,定义域离散的是序数比例尺。
线性比例尺
d3.scale.linear()- 创建一个线性比例尺
linear(x)- 输入一个在定义域中的值 x,返回值域内对应的值
linear.invert(y)- 输入一个在值域中的值 y,返回定义域内对应的值
linear.domain([numbers])- 设定或获取定义域
linear.range([values])- 设定或获取值域
linear.rangeRound(values)- 用rangeRound() 代替range() 后,则比例尺输出的所有值都会舍入到最接近的整数值。对输出值取整有利于图形对应精确的像素值,避免边缘出现模糊不清的锯齿。
linear.clamp([boolean])- 默认情况下,线性比例尺可以返回指定范围之外的值。例如,假如给定的值位于输入值域之外,那么比例尺也会返回一个位于输出范围之外的值。不过,在比例尺上调用clamp(true) 后,就可以强制所有输出值都位于指定的范围内。这意味着超出范围的值,会被取整到范围的最低值或最高值(总之是最接近的那个值)。
linear.nice([count])- 优化 domain (定义域),把两端的值扩展到最接近的整数,但并不是四舍五入的
linear.ticks([count])- 返回格式化的数字用于显示刻度值的值
linear.tickFormat(count, [format])- 返回格式化的数字用于显示刻度值的值,格式参数 format 用于指定格式符号,"$" - 本地货币符号的前缀或后缀,"%" - 转化为百分比数值
序数比例尺
d3.scale.ordinal()- 创建一个序数比例尺
返回颜色的序数比例尺
d3.scale.category10()
创建一个序数比例尺,返回以下10种类型的颜色
d3.scale.category20()
创建一个序数比例尺,返回以下20种类型的颜色
d3.scale.category20b()
创建一个序数比例尺,返回以下20种类型的颜色
d3.scale.category20c()
创建一个序数比例尺,返回以下20种类型的颜色
坐标轴
d3.svg.axis()- 创建一个坐标轴
axis(selection)- 将坐标轴应用到选择器上,选择器必须包含svg或者g元素
axis.scale([scale])- 如果指定了 scale 参数则设置刻度尺,并返回轴。如果未指定 scale 参数,将返回坐标轴当前的刻度尺,默认为线性刻度
axis.orient([orientation])- 设置坐标轴的方向,"top"、"bottom"、"left"、"right"
axis.ticks([arguments…])- 参数会传递给scale.ticks生成刻度值
axis.tickValues([values])- 如果指定了 values 数组,指定的数值 将用于刻度,而不是使用使用比例尺的自动刻度生成器
axis.tickSize([inner, outer])- 如果指定了 inner 和 outer ,设置内部和外部刻度尺寸为指定的值并返回轴。如果 inner 和 outer 没有指定,返回当前的内部刻度尺寸,默认是6。
axis.innerTickSize([size])- 设置内部刻度尺寸为指定的值
axis.outerTickSize([size])- 设置外部刻度尺寸为指定的值